In the healthcare field, there is a concept called “precision medicine.” This revolutionary idea moves from a one-size-fits-all approach that suits some patients (but not others) towards customized solutions tailored to the specifics of a patient’s illness.
If a patient has lung cancer, for example, let’s provide the patient with treatments that target the genetic profile of the specific tumor and customize a drug to destroy that tumor type. What a wonderful concept! Precision therapies are now being developed to support this new paradigm.
We as investors need to embrace this concept and move toward what we will call “precision investing.” Specifically, we need to build investment tools to focus on investment outcomes instead of only looking at returns that only approximate success.
Look at two commonly recognized groups of investors: fundamental and quantitative. On average, fundamental managers, or stock pickers, have provided little or no value after controlling for known sources of return. In other words, they are not terribly precise. Quantitative managers typically focus on harvesting factor premiums such as size, value, momentum, quality, or low volatility. Here the issue of precision is more subtle. A quantitative orientation seems to imply precision. However, we must distinguish between precision (hitting the same target again and again) and accuracy (hitting the right target). We find that some popular quantitative strategies, particularly those under the smart beta moniker, suffer from being imprecise and/or inaccurate.
To help evaluate investment portfolios, we have developed two metrics: a Factor Efficiency Ratio (FER) and a Factor Stability Ratio (FSR). This pair of ratios jointly captures the precision (FSR) and accuracy (FER) of a strategy’s ability to deliver the desired exposures. These kinds of metrics are useful in selecting any strategy (but particularly quantitative) to gauge the chance of how well the strategy will deliver on its promises.
Targeting the outcome some examples
Let’s take the idea of precision and accuracy and apply it to outcomes. One dimension that is rarely talked about is the time-variation of factor cycles. For example, if the value factor cycle is four times as long as the volatility cycle, how does that inform the factor allocation best able to achieve a desired outcome? Here are some illustrations of outcomes:
- A pension plan needs to beat a 3% return over inflation with 95% confidence over a five-year horizon and looks to quality, low-volatility, and value factors due to the cycle length of these factors.
- A target date plan has a glide path that moves from longer dated to shorter dated factors as it approaches retirement date to manage retirement income risk.
- An investor values consistent outperformance over short-to-intermediate term on an information ratio basis focuses on identifying high quality stocks within a value universe.
In each of these outcome-oriented illustrations and others, how do we assemble allocations to achieve our goals? We have found that strategies with high information ratios significantly improve the probability of achieving desired outcomes using simulated results (see chart below). These also tend to be the most efficient strategies, as defined by our efficiency metrics. So we expect more efficient, more precise strategies to have a higher probability of achieving desired outcomes.
Exhibit 1: probability of benchmark underperformance
Using a more efficient portfolio with a high information ratio manager reduces the probability of underperforming over various time periods. This is based on simulations for illustrative purposes only.
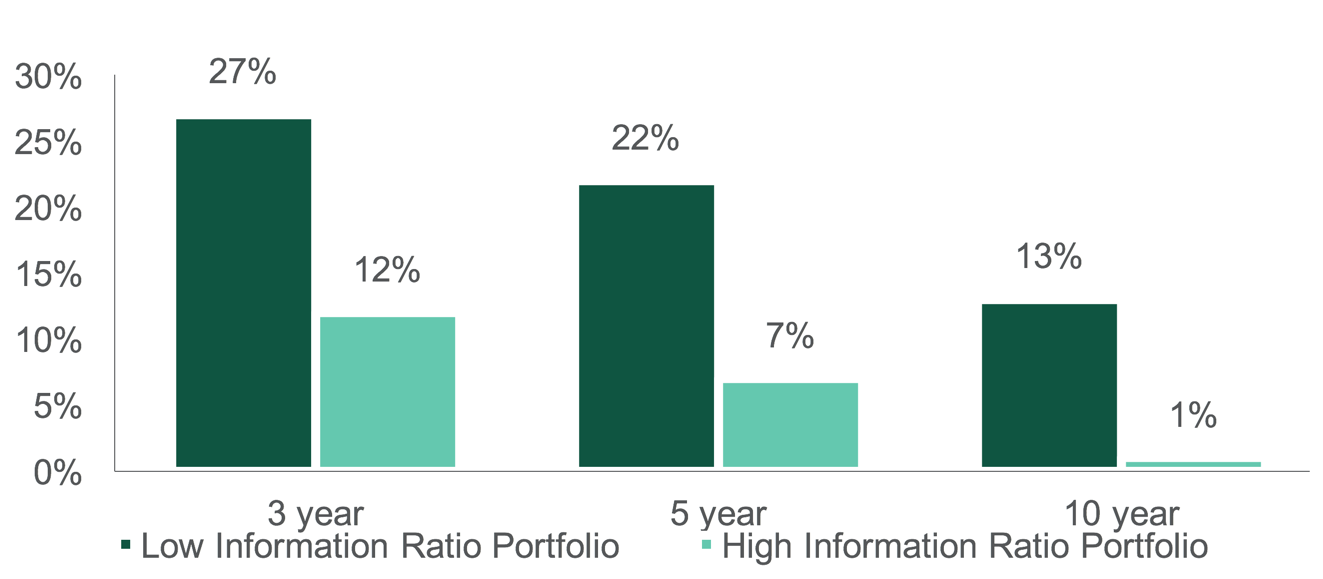
Source: Northern Trust Asset Management. Information ratio is defined as excess return divided by tracking error. The data is based on a Monte Carlo simulation of 100,000 return paths for each portfolio spanning 10 years, for illustration purposes only. The high information ratio portfolio has an information ratio of 0.7 and the low information ratio has an information ratio of 0.4.
Check your portfolio for precision investing
The industry is going towards targeted and intentional portfolio construction. Great news, we are 100% in favor. We believe using highly efficient strategies drives high information ratios, which leads to desired outcomes without the potentially nasty side effects. So check your strategies' construction carefully because the efficiency and consistency of factor exposure will drive the outcome, not individual stocks or the "smartness" of the strategy!