Lately we’ve heard the same lamentable question from many of our clients: my portfolio isn’t working, how should I fix it? Over the last few years there seems to be a growing dissatisfaction with the performance of asset portfolios in general and equity portfolios in particular. While this outcome is certainly unfortunate, it affords the opportunity to reexamine the portfolio construction process starting with a clean slate.
Since 2015 we have conducted more than 70 “deep dives” into client equity holdings with the goal of identifying the primary drivers of risk and return. The ultimate objective of these exercises is to determine if portfolios are earning adequate excess returns for the active risks they are taking and fees they are paying. Across all of these clients the answer was a resounding “NO”. We found lots of active risk but very little raw material for active returns.
Conceptually, we can think of equity returns as accruing from three primary sources:
- Index Beta - the passive return of the aggregate market
- Active Management - ‘stock picking’ or the skill of the fundamental active manager
- Factors - systematic tilts to compensated factors like value, size, quality, etc.
These three sources come with very different price tags. Beta tends to be the least expensive as market returns can be captured passively at very low cost. In contrast, ‘stock picking’ in the form of fundamental active management comes at a steep premium. Factors-based strategies tend to fall somewhere in between.
Despite this difference in cost structure across the 70 portfolios analyzed nearly 60% of equity allocations were to active managers, by far the most expensive source of returns. The remaining 40% of exposure was primarily passive index beta. Although many of these portfolios contained at least some managers with significant exposure to factors these managers’ exposure tended to net out across the portfolio to contribute almost nothing to active performance. ‘Stock picking’ then was the sole source of excess return.
In our previous IIN blog Pick Factors Not Managers we showed that over the last 50 years virtually all excess return in the equity market has been generated by factor exposures while active manager ‘stock picking’ destroyed value, on average. This, of course, does not mean all active managers underperformed, only that the mean of returns attributable to skill was negative. Given that most portfolios analyzed held allocations to ten or more managers it was not surprising they should net to something like the mean return. Even though these asset owners came from every corner of the institutional world, e.g., sovereign wealth funds, large and small public and private pensions, insurance companies, foundations and family offices, findings were very consistent: most of their portfolios, despite being complex and costly, underperformed their benchmarks before fees.
When viewed in this way the solution presents itself. Replacing fundamental active managers with factor-based strategies has been a growing trend among asset owners globally as they recognize consistent positive excess returns can be accessed at a lower cost, the proverbial “win-win”. However, this transition has not come without some complication.
Fundamental active managers tend to have relatively concentrated holdings, i.e., a handful of major bets with high active risk and high expected returns. On the other hand, factor-based strategies tend to be much more diversified, take less risk and have somewhat lower return expectations. Thus, to maintain the same level of portfolio expected return we cannot simply trade a dollar of actively managed assets for a dollar of a factor-based strategy. We may need to expand the non-passive portion of the portfolio to keep aggregate expected returns equal.
We addressed this issue in our white paper Improving Active Risk Budgeting where we presented two hypothetical portfolios. The first portfolio, A, is a traditional core-satellite structure with 30% of assets allocated to traditional active managers and 70% to passive indexing. The second portfolio, B, expands the non-passive allocation to 60% with the remaining 40% passively indexed.

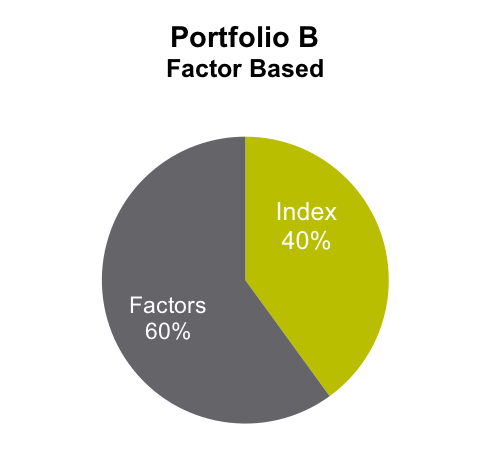
Although portfolio B seems risker due to a lower passive allocation we show that, in reality, the opposite tends to be true. A key benefit of factor-based strategies is they are often very risk-efficient, generating very high information ratios. Traditional active managers, on the other hand, tend to be largely agnostic to risk, yielding relatively lower information ratios. Because factor-based strategies use risk so efficiently expanding the non-passive portion of the portfolio can produce commensurate or even lower total active risk than traditional core-satellite frameworks.
For example, consider the hypothetical example shown below. By reducing the passive index allocation Portfolio B can achieve the same expected excess return but with lower active risk and a considerably higher information ratio, representing a much better use of the equity risk budget. Note here that given the findings of our previous IIN blog the expected excess return and information ratio for active strategies may be very generous.
|
|
Allocation |
Expected Excess Return |
Active Risk |
Information Ratio |
|
|
|
|||
|
Index |
70% |
0 |
0 |
0 |
|
Active |
30% |
4.0% |
10.0% |
0.40 |
|
Portfolio A |
|
1.2% |
3.0% |
0.40 |
|
|
|
|
|
|
|
Index |
40% |
0 |
0 |
0 |
|
Factors |
60% |
2.0 |
2.9% |
0.70 |
|
Portfolio B |
|
1.2% |
1.7% |
0.70 |
Note: The results above are simulated hypothetical based on gross returns for illustrative purposes. Source: Northern Trust Quantitative Research
More importantly, because they are so efficient, factor-based strategies tend to have a much narrower range of outcomes over time. This is illustrated in the ten-year portfolio simulations shown below. While Portfolio A can achieve a higher return than Portfolio B, it also has a wider distribution of performance, i.e., more risk.
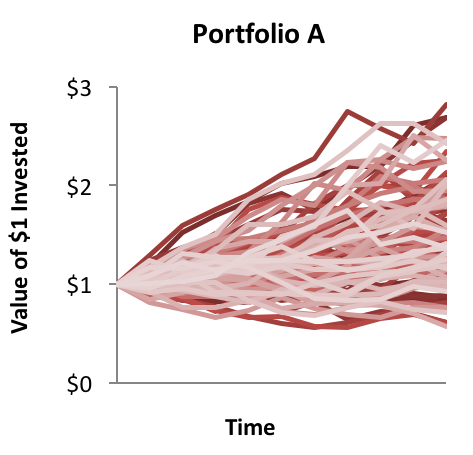
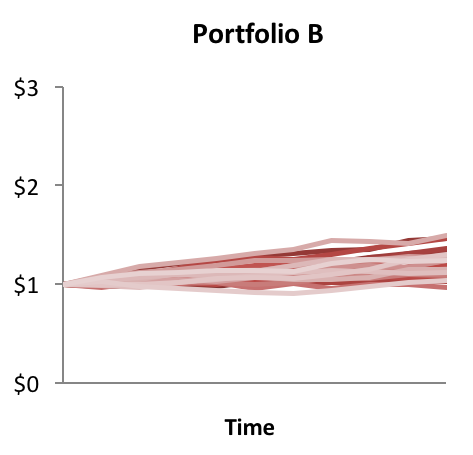
Note: The results above are simulated/hypothetical returns based on gross returns for illustrative purposes based on a 10-year Monte Carlo analysis. Source: Northern Trust Quantitative Research
The key message is despite somewhat large allocations a portfolio built around factors can have a higher probability of outperforming benchmarks which is, after all, the whole point of taking active risk in the first place. Our simulation studies suggest differences in out/underperformance probabilities are very significant, as shown below. Portfolio Construction 2.0 means replacing active managers with factor allocations to improve outcomes and information ratios.
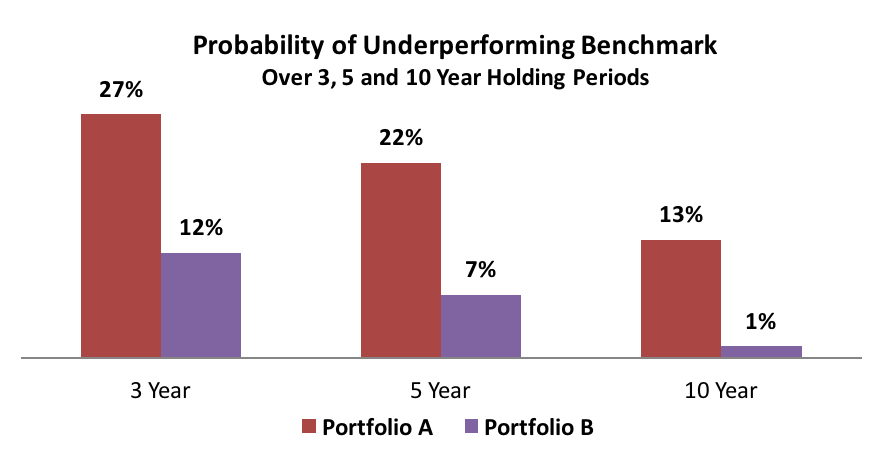
Note: The results above are simulated/dhypothetical returns based on gross returns for illustrative purposes based on a 10-year Monte Carlo analysis. Source: Northern Trust Quantitative Research, further details in Improving Active Risk Budgeting
To this point we have spoken of factors in very general terms. Although the question of which factor or set of factors to include in the portfolio will be discussed in-depth in a future blog, for now we simply note that most factor investors fall into one of two camps: offensive and defensive. Offensive investors are primarily concerned with capital appreciation, being characterized by high return objectives, e.g., underfunded pensions, and/or long holding periods, e.g., foundations. These investors have gravitated to value portfolios where a secondary factor like quality has been used to distinguish the “good buys” from the “falling knives”.
In contrast, defensive investors are more concerned with capital preservation, e.g., well-funded pensions and short-horizon investors. Many of these asset owners have implemented low-volatility strategies, again with a quality component to differentiate companies with highly-stable operating models from thinly traded clunkers. As shown in the table below, factor-based strategies have been very effective in meeting the needs of both types of investors.
|
Ending April 2016 |
Russell 1000 |
Northern Trust Quality Value Portfolio (Russell 1000) |
Northern Trust Quality Low-Volatility Portfolio (Russell 1000) |
|
20 Year Return |
8.1% |
10.0% |
9.8% |
|
20 Year Risk |
15.5% |
15.4% |
11.2% |
|
20 Year Sharpe Ratio |
0.32 |
0.61 |
0.45 |
Source: Northern Trust Quantitative Research.
Note: Northern Trust Quality Low Volatility (QLV) and Northern Trust Quality Value Portfolio (QVP) reflect back-tested returns for the Quality Low Volatility and Quality Value Portfolio strategies, respectively, in the Russell 1000 investment universe. Back-tested performance results do not reflect actual trading and have certain inherent limitations. The back-tested data contained herein does not represent the results of an actual investment portfolio but reflects the historical strategy performances of QLV and QVP, respectively. Past Performance is not indicative of future results. For Illustrative Purposes Only. Please see important information on Hypothetical Returns at the end of this blog.
Are you completely satisfied with your portfolio? Chances are you’ve answered in the negative. If so, it may be a great opportunity to consider a new portfolio construction, version 2.0, which explicitly places factors as the key driver of portfolio returns.
Important Information
Important Information on Hypothetical Returns - Where hypothetical portfolio data is presented, the portfolio analysis assumes the hypothetical portfolio maintained a consistent asset allocation (rebalanced monthly) for the entire time period shown. Hypothetical portfolio data is based on publicly available index information. All information is assumed to be accurate and complete but is not guaranteed.
Hypothetical portfolio data contained herein does not represent the results of an actual investment portfolio but reflects the historical index performance of the strategy described which were selected with the benefit of hindsight. Components of the hypothetical portfolio were selected primarily utilizing actual historic market risk and return data. If the hypothetical portfolio would have been actively managed, it would have been subject to market conditions that could have materially impacted performance and possibly resulted in a significant decline in portfolio value.