Recently, I’ve acquired the habit of drawing parallels between equity factor and fixed income investing. While this is something I’ll have to shake one day, for now I can’t help but point out one striking similarity that is often overlooked or flatly ignored – the need for stability and control.
Core fixed income portfolios are typically managed with very tight bounds on duration, option adjusted spread, and yield, thereby ensuring delivery of intended exposures. It would be unthinkable for a core bond allocation to have a duration of, say, 12 years today, 2 years a week ago and 8 years three months from now. That kind of inconsistency would wreak havoc on portfolio performance, make risk management nearly impossible, and leave any attempt at asset allocation modeling completely moot. So to obtain the desired results from fixed income, it’s obvious these exposures need to be closely managed.
Why then do we hold equity factors to different standards? Although equity factors may rightly serve as core allocations, it seems the industry has not only allowed, but advocated, for uncontrolled and inconsistent exposure that’s further perpetuated from a lack of stabilizing mechanisms and overall poor product design. This inconsistency in equity factors should deliver the same result as fixed income: difficult performance attribution, impossible risk management and futile factor allocation exercises.
Consider fundamentally weighted indexes, widely deemed the original ‘smart beta’ strategies, which are derived from weighting schemes based on sales, revenues, etc. Although many of these indexes are marketed as delivering factor exposure (typically size and value), their simple, ad-hoc construction does not allow for any degree of precision in managing these exposures.
For example, Chart 1 details the value content of the RAFI US 1000 fundamentally weighted index (as measured by the Barra USE3 risk model). While this index does indeed provide a meaningful level of value exposure (anything over 0.20 being generally accepted as significant), we note the value content oscillates in a wide range between 0.14 and 0.55, increasing almost 300% in the 16 months between December 2007 and June 2009, and falling by almost 50% in the subsequent 12 months. Although less extreme, post-financial crisis exposures were also volatile.
chart 1: Barra Value exposure of RAfi 1000 index
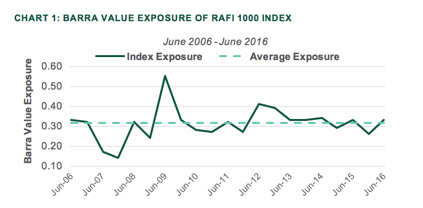
Source: Northern Trsust Asset management
The Russell Fundamental US index is constructed in a manner similar to the RAFI US 1000 index and it also has no mechanism for controlling factor exposures. As shown in Chart 2, the value content of this index ranges from a low of 0.09 to a high of 0.26, increasing almost 75% in the 24 months between June 2010 and June 2012, and subsequently falling just as rapidly. Although the range of value exposure of the Russell Fundamental index is less extreme than the RAFI US 1000 index, we note the average exposure is also less, 0.18 vs. 0.31, which leads us to question which index is actually more stable?
Chart 2: Barra Value Exposure Russell Us Fundamental Index
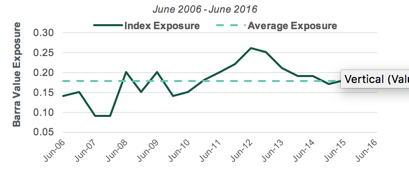
Source: Northern Trust Asset Management
To quantify and compare stability we propose a simple metric we’ll call the Factor Stability Ratio (FSR) computed as:

Here the numerator is the standard deviation of historical factor exposures; computed using a risk model like Barra or Axioma, and the denominator is the mean of those same historical exposures. To facilitate comparison across products it is necessary to scale the standard deviation, i.e. the measure of variation, by the average factor exposure to arrive at how much factor exposure you’re getting per unit of risk.
In Chart 3 we detail what the FSR looks like for three factor-based indices. The first two indices on the left are about equal, each delivering roughly four units of factor exposure per unit of volatility. For comparison we also graph the FSR for the Russell 1000® Value Index, which produces almost six units of factor exposure per unit of volatility (i.e. it is considerably more stable). We can attribute this difference to the latter’s intentional exposure to value, which gives it a strong advantage over products with ad-hoc value content.
chart 3: Factor Stability ratios
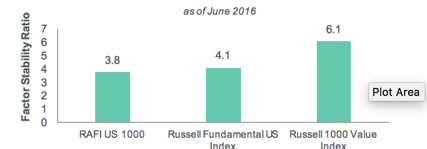
Source: Northern Trust Asset Management
However, the construction of the Russell 1000® Value Index is quite simplistic and may not necessarily provide the most stable source of value exposure possible. It has no mechanism to control for other factor exposures that may be correlated with value and, therefore, disruptive to the indexes value content.
One such disruption is the strong low quality factor bias found in the Russell 1000® Value Index. In our white paper What is Quality? we show that low quality stocks tend to have significantly higher price volatility than high quality stocks. And because value is a price-based measure (e.g., price to earnings, price to book, etc.), any incremental price volatility from a low quality bias could translate into a higher volatility of value exposure and, hence, a lower FSR.
This point is subtle, but critical, and bears repeating. Since most factors (e.g., value, momentum, low volatility, dividend yield and even size) utilize price-based characteristics, any extraneous (unintentional), factor exposures that increase price volatility could lower the stability of your intended factors.
In our white paper Understanding Factor Tilts we show that high price volatility is most closely associated with low quality, high momentum and high volatility biases. To the extent these exposures enter the portfolio due to poor or overly-simplistic product design, the intentional factor content will be correspondingly unstable. The same result will also be observed in portfolios with strong biases to higher price volatility sectors and regions.
So to bring this back to my earlier comments about fixed income and stability, why would you allow your equity factor exposures to run amok when everything else in your portfolio is managed with precision? Achieving stable factor exposure isn’t rocket science, but yet, it has been systematically ignored by most nascent factor-based equity strategies. The toxicity of instability is very real and can have extremely detrimental effects on portfolio outcomes.
REFERENCES
- Understanding Factor Tilts, Northern Trust, June 2013
- What is Quality?, Northern Trust, 2013
IMPORTANT INFORMATION. This material is provided for informational purposes only. Information is not intended to be and should not be construed as an offer, solicitation or recommendation with respect to any transaction and should not be treated as legal advice, investment advice or tax advice. Current or prospective clients should under no circumstances rely upon this information as a substitute for obtaining specific legal or tax advice from their own professional legal or tax advisors. Information is confidential and may not be duplicated in any form or disseminated without the prior consent of Northern Trust. Northern Trust and its affiliates may have positions in, and may effect transactions in, the markets, contracts and related investments described herein, which positions and transactions may be in addition to, or different from, those taken in connection with the investments described herein. All material has been obtained from sources believed to be reliable, but the accuracy, completeness and interpretation cannot be guaranteed. Information contained herein is current as of the date appearing in this material only and is subject to change without notice. Indices and trademarks are the property of their respective owners. All rights reserved.