When factor performance disappoints, you have to ask: is the problem the factor or sector bias?
With rising interest rates, some investors are worried that low volatility equity strategies will underperform. Their concern is largely based on some crude statistical analysis that’s been making its way around the industry. However, when we look under the hood, we find that rate sensitivity is a sector phenomenon not a factor phenomenon. This is a perfect example of the importance of purity and design in low volatility or any factor investing.
A little bit of hysteria
We think Exhibit 1 is the chief culprit behind the idea that the low volatility factor strategies will start underperforming as rates rise. Historically, low volatility equity performance has a significant negative correlation to interest rates. In other words, as rates rise, the graphs seems to suggest that the low volatility factor returns could decline relative to the broad market. This is fueling a little hysteria, maybe scaring off investors from the low volatility equity factor as the Federal Reserve marches rates upward.
However, take a closer look at a lot of low volatility strategies, and you’ll see that they are strongly overweight to the consumer staples and utilities industries. These sectors have bond-like qualities and are negatively correlated to rising interest rates. So a low volatility strategy weighted to those sectors will be negatively correlated to interest rates as well.
Exhibit 1: low volatility and interest rates: Investors are concerned that the historical negative correlation between interest rates and low volatility equity means bad news as rates rise. This doesn’t tell the full story.
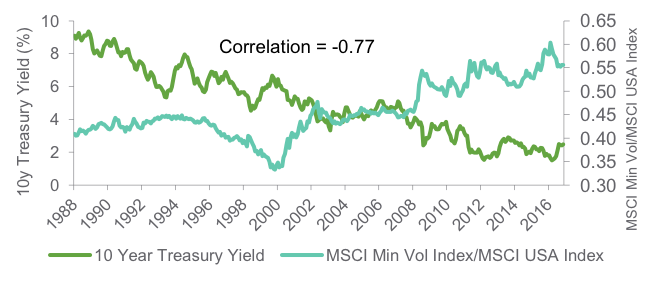
Source: Northern Trust Quantitative Research, Bloomberg, MSCI. Data as of 3/31/17. The MSCI Minimum Volatility USA Index aims to reflect the performance characteristics of a minimum variance strategy. The MSCI USA Index measures large and mid cap segments of the U.S. market. Past performance is no guarantee of future results. Index performance returns do not reflect any management fees, transaction costs or expenses. It is not possible to invest directly in any index.
It’s the design, not the factor
When we talk about factor investing, we say design is everything. Factor strategies should efficiently target factors, removing noise such as sector biases. This type of noise really can be the Achilles heel of factor investing and drive many investors to believe that it doesn’t work.
There’s no need to take extreme sector biases. Exhibit 2 shows two low volatility equity strategies. Strategy A is taking heavy sector bets while Strategy B has relatively light sector biases. The design of the factor based strategy has everything to do with interest rate sensitivity. Less sector bias means less interest rate sensitivity. Rate sensitivity is at the sector level, not the factor level. That’s the important thing to distinguish.
The idea of eliminating the noise in factor investing doesn’t only apply to low volatility strategies, but to any factor strategy. The unintended biases need to be removed to achieve the expected outcome. If you form efficient factor strategies that do not take material sector biases, you can sidestep this problem.