By Michael Hunstad, Ph.D., Head of Quantitative Research, Northern Trust Asset Management
mrh12@ntrs.com
We frequently hear the comment: “you can’t “eat” information ratio”, often from investors who dismiss low-active risk, high-information ratio (IR) equity products on the grounds that they produce returns insufficient to make them interesting. In pursuit of “juice,” these investors seek out high returns under the seemingly common-sense view that risk is something separate and distinct from return. After all, many of these investors’ bonuses are based on performance rather than risk mitigation (i.e. they are paid to take more risk). We feel this argument is ultimately specious, and that not only is information ratio edible, it can be a particularly tasty treat. So in order to maximize your bonus, high-information ratio managers should be the rule.Table 1 details the historical performance of all U.S. equity managers with positive 10 year information ratios (for simplicity, we’ve bucketed these managers by tracking error). Based on these figures, from which bucket would you hire managers? Many investors choose the high tracking error bucket with 2.0% average return and 8.7% tracking error, as indeed this bucket has more than twice the realized return of the low tracking error bucket. However, it also has the lowest information ratio, suggesting active risk may not be efficiently utilized1.
TABLE 1: US EQUITY MANAGERS WITH POSITIVE 10 YEAR INFORMATION RATIOS
|
Tracking Error (TE) |
Excess Return (10Y Avg.) |
Tracking Error (10Y Avg.) |
Information Ratio (10Y Avg.) |
Count |
|
hLow: <3% |
0.9% |
1.9% |
0.44 |
185 |
|
Medium: 3-6% |
1.3% |
4.6% |
0.28 |
620 |
|
High: >6% |
2.0% |
8.7% |
0.23 |
765 |
Source: eVestment. Represents all U.S. long-only active equity managers. Figures are net of fees as of December 31, 2015
Managers that use risk more efficiently, and thus generate lower tracking error and higher information ratios, have a greater chance of producing positive active returns.
Naturally, investors see 2.0% excess return is greater than 0.9% and say: I want that. But what exactly is ‘that’? Certainly we can’t expect managers in the high tracking error bucket to earn exactly 2.0% excess return going forward. The best we can say is that, assuming historical returns are indeed indicative of future performance, there is roughly a 50% chance our high-TE manager will return more than 2.0% and a 50% chance they will return less than 2.0%. The problem with that view is that these managers have such a high tracking error that there is a significant probability their active returns will end up being negative. We can, perhaps, safely assume underperforming managers don’t lead to high bonuses.
In contrast, managers that use risk more efficiently, and thus generate lower tracking error and higher information ratios, have historically had a greater chance of producing positive active returns. To illustrate, Figure 1 plots the difference in probability of a low-tracking error manager producing positive excess returns versus a high-tracking error manager. Figures were calculated over 25 years using data from Table 1.
FIGURE 1: DIFFERENCE IN PROBABILITY OF PRODUCING POSITIVE EXCESS RETURNS - AVERAGE LOW TRACKING ERROR MANAGER (0.44 IR) VERSUS HIGH TRACKING ERROR MANAGER (0.23 IR)
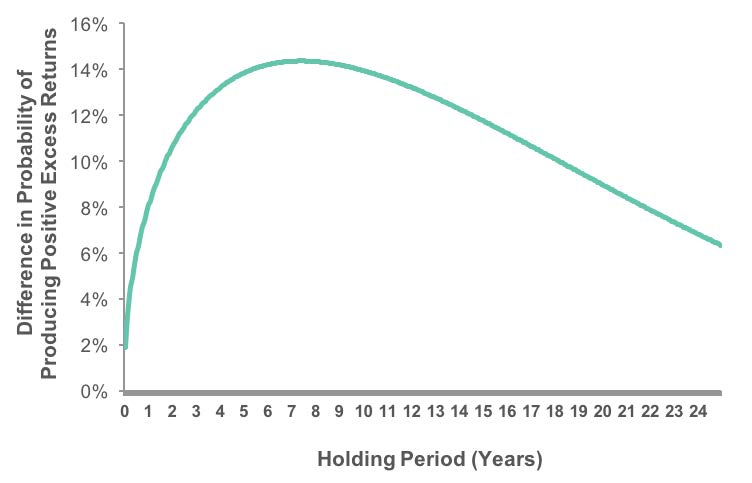
Source: Northern Trust Quantitative Research and eVestment. See Technical Note
In the first year the difference in likelihood is about 6%, suggesting lower-tracking error managers have a higher chance of producing positive excess returns.
In the first year the difference in likelihood is about 6%, suggesting lower-tracking error managers have a higher chance of producing positive excess returns. As the holding period extends beyond one year the probability grows, reaching more than 14% by year six. It’s important to note the expected return of these managers hasn’t changed over the holding period; high- and low-tracking error managers still have an expected annual alpha of 2.0% and 0.9%, respectively. However, the tracking error of both managers grows with the square root of time and the probability of negative returns increases at a faster rate for the high-tracking error manager (see technical note at the end). We’ll call this phenomenon temporal downside asymmetry (TDA), which suggests protecting yourself from the worst outcomes (i.e. negative performance) is very much a function of information ratio.
Of course, we still face the issue of low-tracking error managers having lower expected excess return or “juice.” Here we note many asset owners use active managers, particularly high-tracking error managers, as satellite or non-core allocations in order to achieve that juice. In our previous blog Portfolio Construction 2.0, we showed how we can utilize higher-information ratio managers and still maintain the same portfolio expected excess return by making a larger satellite allocation. In this case we would scale up the satellite allocation by a factor of 2.2x (2.0% / 0.9%). So, if the hypothetical satellite represented 15% of the original portfolio at a 2.0% expected alpha we could increase the satellite allocation to 33% with an expected alpha of 0.9% and maintain the same portfolio expected alpha: 2.0% * 15% = 0.9% * 33%.
Importantly, this scaling process doesn’t impact TDA; higher-information ratio managers still have a much lower likelihood of negative excess returns. So, we get the best of both worlds – an identical expected excess return and a lower probability of negative returns. Even if your manager doesn’t hit their return target exactly, you may have a much better chance of earning something and the last we checked most bonus programs give higher compensation for positive returns than negative returns.
Admittedly, some asset owners may balk at the time horizon required to reap the full benefit of TDA, e.g. from Figure 1 we don’t reach the maximum difference in probability until year 8. Investors with shorter holding periods may be left with the impression that information ratio is, to them, less important. However, as we will see, this impression is ultimately false.
Investors with shorter holding periods may be left with the impression that information ratio is, to them, less important. However, as we will see, this impression is ultimately false.
In Figure 2 we repeat the calculations described above, this time comparing the difference in probabilities of hypothetical high-IR managers to the average high-TE, low-IR managers from Table 1. A few observations are worth noting. First, as the information ratio of our hypothetical manager increases, the likelihood it will produce positive returns increases. Second, as the managers’ IR increases, the maximum benefit of TDA is obtained at shorter horizons. The dotted line traces the locus of points that represent the optimal difference in probabilities. So contrary to the potential impression that information ratio is ‘less important’ to investors with shorter time horizons, the reality is that shorter time horizons find high-IR to be especially potent. A manager with an IR of 0.9 is almost 30% more likely to generate positive returns over a three year period than a high-tracking error manager from Table 1 with an average IR of 0.23.
FIGURE 2: DIFFERENCE IN THE PROBABILITY OF PRODUCING POSITIVE EXCESS RETURNS - MANAGERS WITH VARIOUS INFORMAITON RATIOS OVER HIGH TRACKING ERROR MANAGER (0.23 IR)
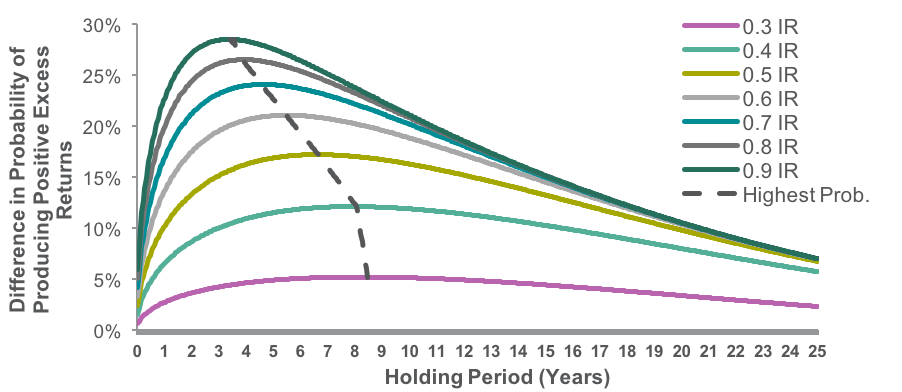
Source: Northern Trust Quantitative Research. See Technical Note.
Can we really have our cake and eat it too? As we’ve shown, you don’t have to compromise on expected returns as allocations to high-IR managers can be scaled to generate the same level of expected alpha as traditional low-IR managers. Importantly, higher information ratios can also increase the likelihood of positive performance from which asset owners with short horizons may benefit most. Given this historical performance, it seems the path to higher compensation has been paved with high-information ratio strategies.
Technical Notes
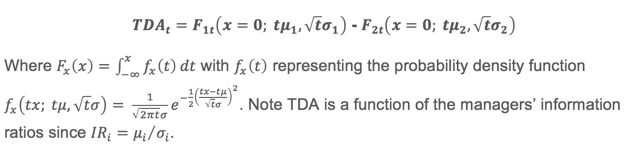
For any two managers the difference in their probability of producing positive excess returns is the difference in their cumulative distribution functions at x=0
Notes
[1] In our previous blog Portfolio Construction 2.0 we explained how information ratio decays as tracking error increases, an outcome of the Fundamental Law of Active Management of Grinold (1989)
References
Grinold, Richard C. "The fundamental law of active management." The Journal of Portfolio Management 15.3 (1989): 30-37.
IMPORTANT INFORMATION. This material is provided for informational purposes only. Information is not intended to be and should not be construed as an offer, solicitation or recommendation with respect to any transaction and should not be treated as legal advice, investment advice or tax advice. Current or prospective clients should under no circumstances rely upon this information as a substitute for obtaining specific legal or tax advice from their own professional legal or tax advisors. Information is confidential and may not be duplicated in any form or disseminated without the prior consent of Northern Trust. Northern Trust and its affiliates may have positions in, and may effect transactions in, the markets, contracts and related investments described herein, which positions and transactions may be in addition to, or different from, those taken in connection with the investments described herein. All material has been obtained from sources believed to be reliable, but the accuracy, completeness and interpretation cannot be guaranteed. Information contained herein is current as of the date appearing in this material only and is subject to change without notice. Indices and trademarks are the property of their respective owners. All rights reserved.
Hypothetical portfolio data contained herein does not represent the results of an actual investment portfolio but reflects the historical index performance of the strategy described which were selected with the benefit of hindsight. Components of the hypothetical portfolio were selected primarily utilizing actual historic market risk and return data. If the hypothetical portfolio would have been actively managed, it would have been subject to market conditions that could have materially impacted performance and possibly resulted in a significant decline in portfolio value.
Past performance is no guarantee of future results. Periods greater than one year are annualized except where indicated. Returns reflect the reinvestment of dividends and other earnings and are shown before the deduction of investment management fees, unless indicated otherwise. Returns of the indexes also do not typically reflect the deduction of investment management fees, trading costs or other expenses. It is not possible to invest directly in an index. Indexes are the property of their respective owners, all rights reserved.